Anyone investing in the US may find Dow Jones’s 10 years return important. It would be very easy to represent the return as a single number, however, there are multiple KPIs related to its performance.
Nominal and annual return of the last 10 years
Dow Jones Industrial Average closed at 52637 on 2026-07-10, while 10 years earlier (on 2016-07-11) it opened at 18162. Nominally this is 189,83% increase, which equals an annual return of 11,23%.
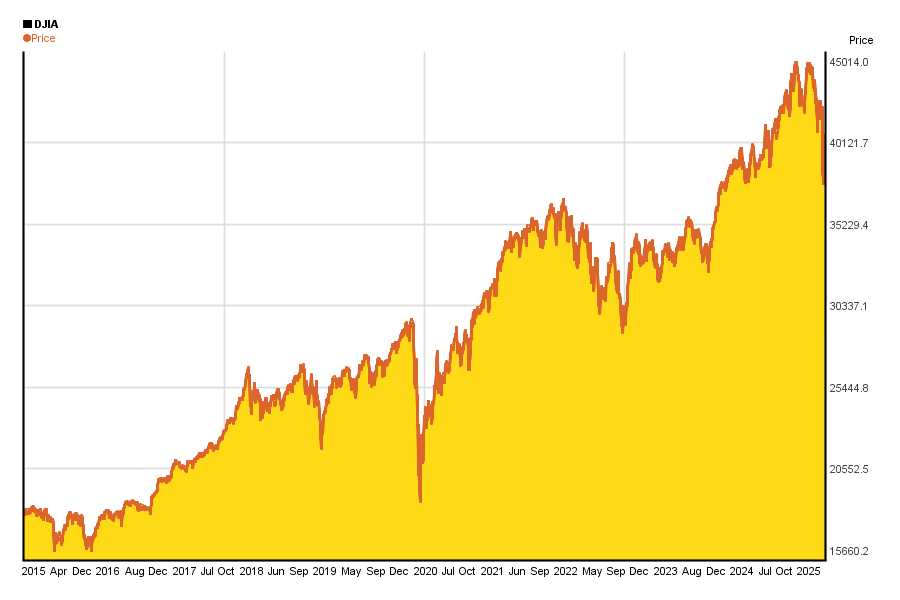
Last 10 years return, year-by-year
As you can see on the chart above, the average return is not a result of a balanced change all the time.
To see how DJIA’s return varied year-to-year in the past 10 years, have a look at the table below:
| Year | Open | Close | Min | Max | Return |
|---|---|---|---|---|---|
| 2016 | 17405,48 | 19762,60 | 15450,56 | 19987,63 | 13,54% |
| 2017 | 19872,86 | 24719,22 | 19677,94 | 24876,07 | 24,39% |
| 2018 | 24809,35 | 23327,46 | 21712,53 | 26951,81 | -5,97% |
| 2019 | 23058,61 | 28538,44 | 22638,41 | 28701,66 | 23,76% |
| 2020 | 28638,97 | 30606,48 | 18213,65 | 30637,47 | 6,87% |
| 2021 | 30627,47 | 36338,30 | 29856,30 | 36679,44 | 18,65% |
| 2022 | 36321,59 | 33147,25 | 28660,94 | 36952,65 | -8,74% |
| 2023 | 33148,90 | 37689,54 | 31429,82 | 37778,85 | 13,70% |
| 2024 | 37566,22 | 42544,22 | 37122,95 | 45073,63 | 13,25% |
| 2025 | 42660,09 | 48063,29 | 36611,78 | 48886,86 | 12,67% |
How steady was the return?
People often say that long term investments carry less risk than short term ones.
Well, on the chart below you can see if that is true for yourself in the case of DJIA for the past 10 years.
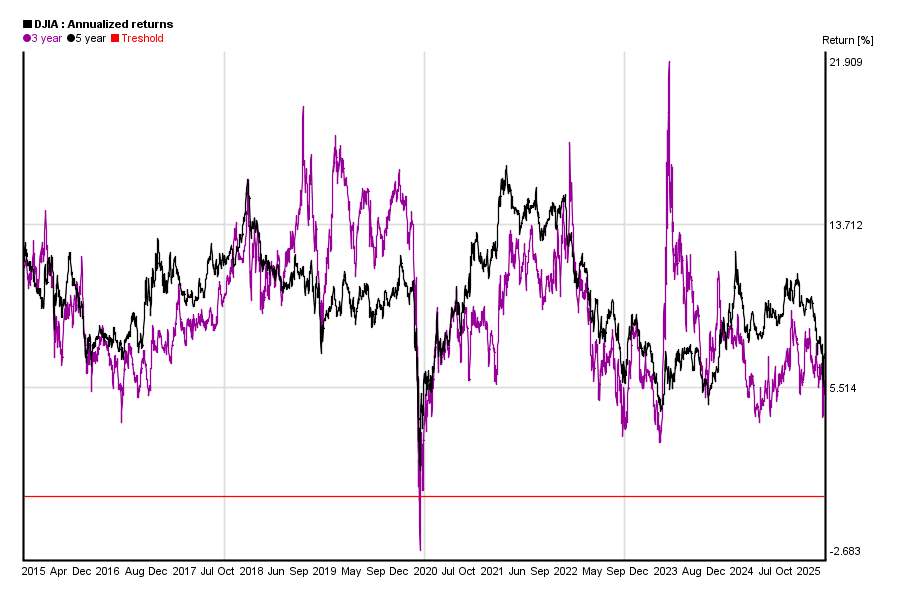
What can you see on the chart?
You can calculate DJIA’s 1 month return from DJIA’s value today and DJIA’s value 30 days ago. You can also do the same calculation for yesterday and DJIA’s value 31 days ago etc. If you do this calculation for each days, you will get a curve of DJIA’s 1 month yield. The same applies to other yield periods from 3 months to 5 years.
- This chart shows the three and the five year yield curve in the past 10 years.
- Treshold marked with red shows 0% return.
Check out all 10 years charts of DJIA here!