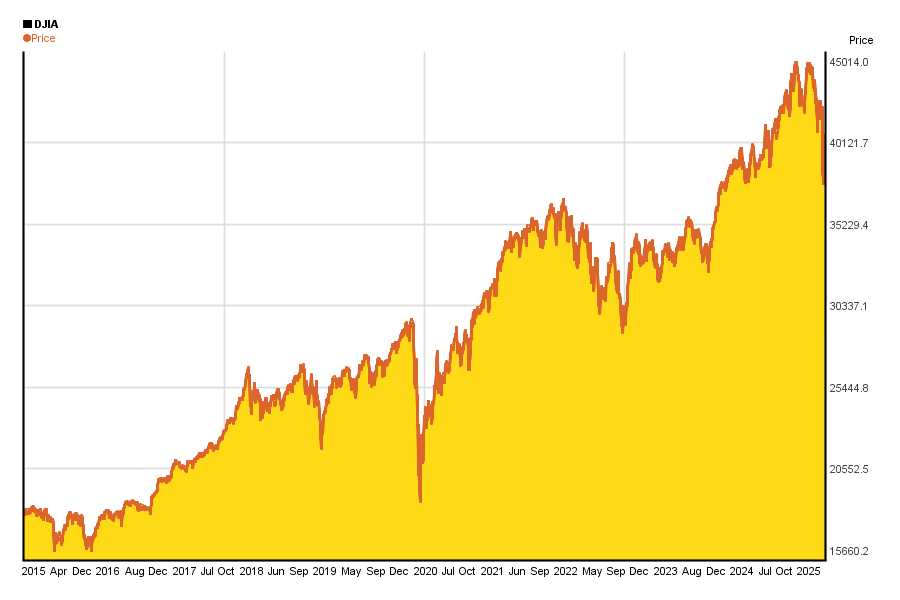
The Dow Jones Industrial Average index has been introduced on 26 May 1896 and it has 30 components today. It is an important signal which provides an insight about the overall stock performance within the region, and the overall increase or decrease in stock value represented by the average of the top performing companies.
In the past 10 years there have been some interesting events in its history, which we have extracted here:
Major trends in the last 10 years
Dow Jones Industrial Average closed at 42198 on 2025-06-13, while 10 years earlier (on 2015-06-15) it opened at 17891. Nominally this is 135,86% increase, which equals an annual return of 8,96%.
(Check out this link for details about Dow Jones’ 10 years perfomance.)

(Further DJIA 10 years charts can be found here).
As far as the 2010 period is concerned, it can be seen that it began parallel with the 2010 European Debt Crisis and more importantly, the 2010 Flash crash. As a result of these events, the performance was quite volatile, and inevitably resulted in a half year loss of around 7.2%.
However, it did eventually get back on track, and increased in value in 2013, when it reached a new record high at 15000 for the very first time. From this point onwards, the increase was almost continuous, and it broke 18000 in 2014.
In 2015 fear of inflation and slowdown of Chinese economy has lead to a drop of DJIA’s value. Latter also caused significant drop in beginning of 2016. In June of 2016 votes for Brexit won in the UK, causing a short-lasting drop of the index.
After Donald Trump was elected as the President of the United States, the Dow rallied significantly, and by 2017, it set a new record high of 20000.
This further skyrocketed and the index exceeded 25000 in Jan 2018. After that fear of rising interest rates and inflation, along with the trade war (started by president Trump) has not allowed the index to exceed its previous high for too long.
2019 began with fear of global economical slowdown, while trade war was a recurring topic, yet DJIA increased with short breaks and ended at an all time high, somewhere above 28500.
However, followed by the outbreak of 2019-nCoV virus and uncertainty across the globe at the beginning 2020, Dow Jones crashed, and lost around 1200 points for a couple days, reflecting high level of fear. Not much later it has recovered its losses.
Changes in the components of the DJIA
Notes about the way of calculating DJIA
Dow Jones Industrial Average is not calculated the same way all the time: eg.: some components are added, some are removed over the years. This has several consequences:
- If you plan to “copy” Dow Jones’ components in your portfolio, and you forget to update it, sooner or later your porfolio will not follow DJIA’s changes.
- If you just look at Dow Jones trends, that will hide from you that some components have been replaced in the average eg.: because they are no longer as important companies as they were, or sometimes because they went bankrupt.
Actual changes in the last 10 years
In the past 10 years history of DJIA, components have changed as follows:
- 2024-11-08: Dow Inc. and Intel Corp. were replaced by Nvidia Corp. and The Sherwin-Williams Company
- 2024-02-26: Walgreens Boots Alliance, Inc. was replaced by Amazon.com, Inc.
- 2020-08-31: Exxon Mobil, Pfizer and Raytheon Technologies were replaced by Amgen, Honeywell Internation and salesforce.com
- 2020-04-06: United Technologies Corporation was replaced by Raytheon Technologies
- 2019-04-01: DowDuPont spun off DuPont and was replaced by Dow Inc.
- 2018-06-26: General Electric was replaced by Walgreens Boots Alliance.
- 2017-09-01: DuPont and Dow Chemical Company merged to DowDuPont
- 2015-03-19: AT&T was replaced by Apple.
- 2013-09-23: Alcoa, Bank of America, and Hewlett-Packard were replaced by Goldman Sachs, Nike, and Visa.
- 2012-09-24: Kraft Foods Inc. was replaced by UnitedHealth.
(Source: https://en.wikipedia.org/wiki/Historical_components_of_the_Dow_Jones_Industrial_Average)