There are number of reasons to study historical charts of gold. Firstly because it is said to be investors’ safe haven and secondly because it is said to be protecting from inflation.
Lots of things happened on gold’s market (who are buying it? who are selling it?) in the past years and one can easily ask if it is really worth as much as it costs?
100 years chart*
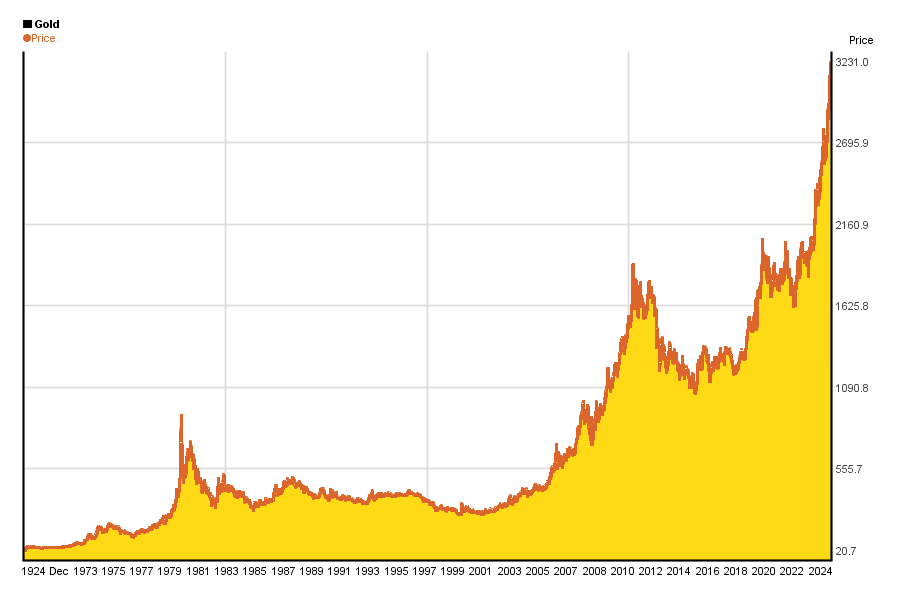
(Prices are in US dollars)
To get closer the real value it is more important to compare gold’s price change to the inflation. (More precisely, to the customer price index, CPI.) Chart below shows the relative change of both since 1948.
One awaits that if gold is protecting us from inflation, its price follows CPI. Well, its price hasn’t always followed CPI. From historical point of view, it had serious spikes in 1980 and since the financial crysis broke out in 2008.
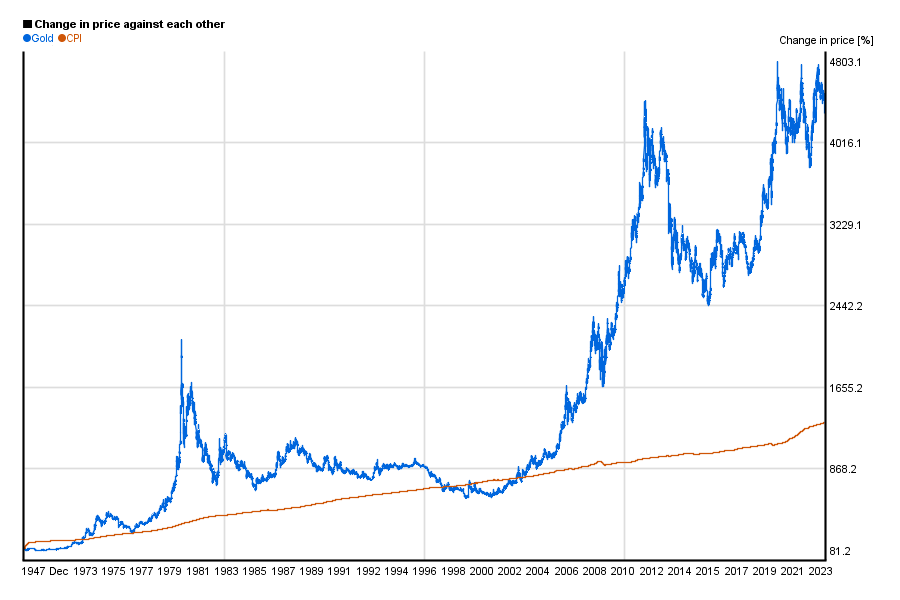
So, how much is gold worth then?
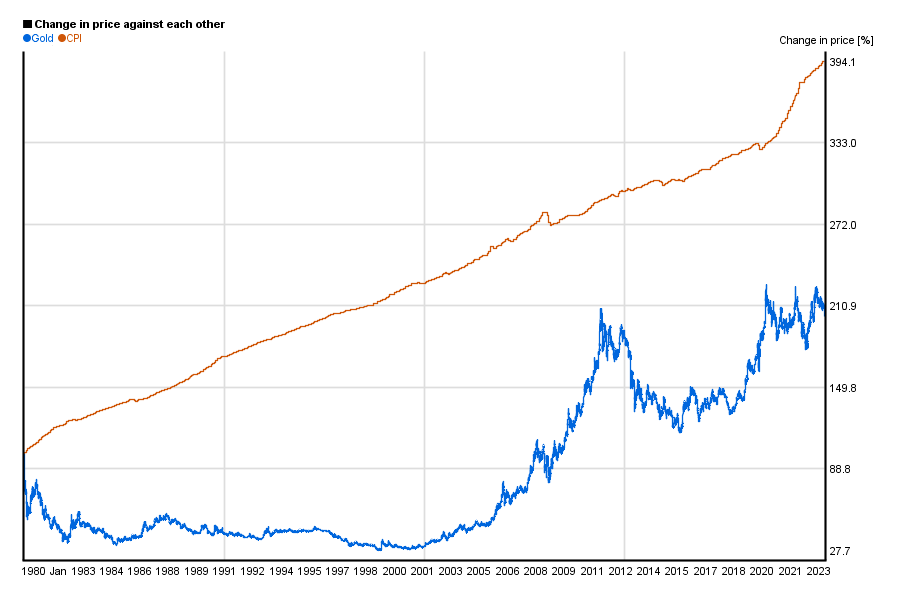
The price is still far above the CPI curve, if we consider chart from 1948. On the other hand, if we compare CPI and gold’s price from 1980, it looks like gold has underperformed CPI (?):
Example calculation
Using CPI we can make a couple estimations for the “real value” based on a couple years** (eg.: closing price was $909.9 in 1980-01-22, CPI was 77.8 in January, 1980, CPI was 243.8 in March, 2017, so current price according to CPI is $909.9 * 243.8 / 77.8 = $2773.1):
| CPI value | gold price ($) | price in March, 2017 according to CPI ($) | |
| 1913 | 9.8 | 20.7 | 515 |
| 1950 | 23.5 | 40.5 | 420 |
| 1979 | 68.3 | 224.1 | 800 |
| 1980 | 77.8 | 909.9 | 2851 |
You can say that one can explain any gold price using inflation, if numbers are chosen carefully 🙂
Truth be told, gold’s price in 1980 has been driven by massive speculation. Nobody can take seriously any present value calculation based on that – it is just misleading.
All other calculations tell, that price above $1000 was too much (in March, 2017), but we only considered CPI, and not all market factors. But this does not mean that it has to go any higher nor means it that it has to fall.
*Charts are updated every month. You can create such charts for yourself with Chartoasis Sesame, or check out the gold’s price charts here up to 10 years (updated every day)
**You can download historical gold data back until 1793 here. You can download US CPI data here.